Tata Data Visualisation: Empowering Business with Effective Insights Virtual Internship
Presentation Video
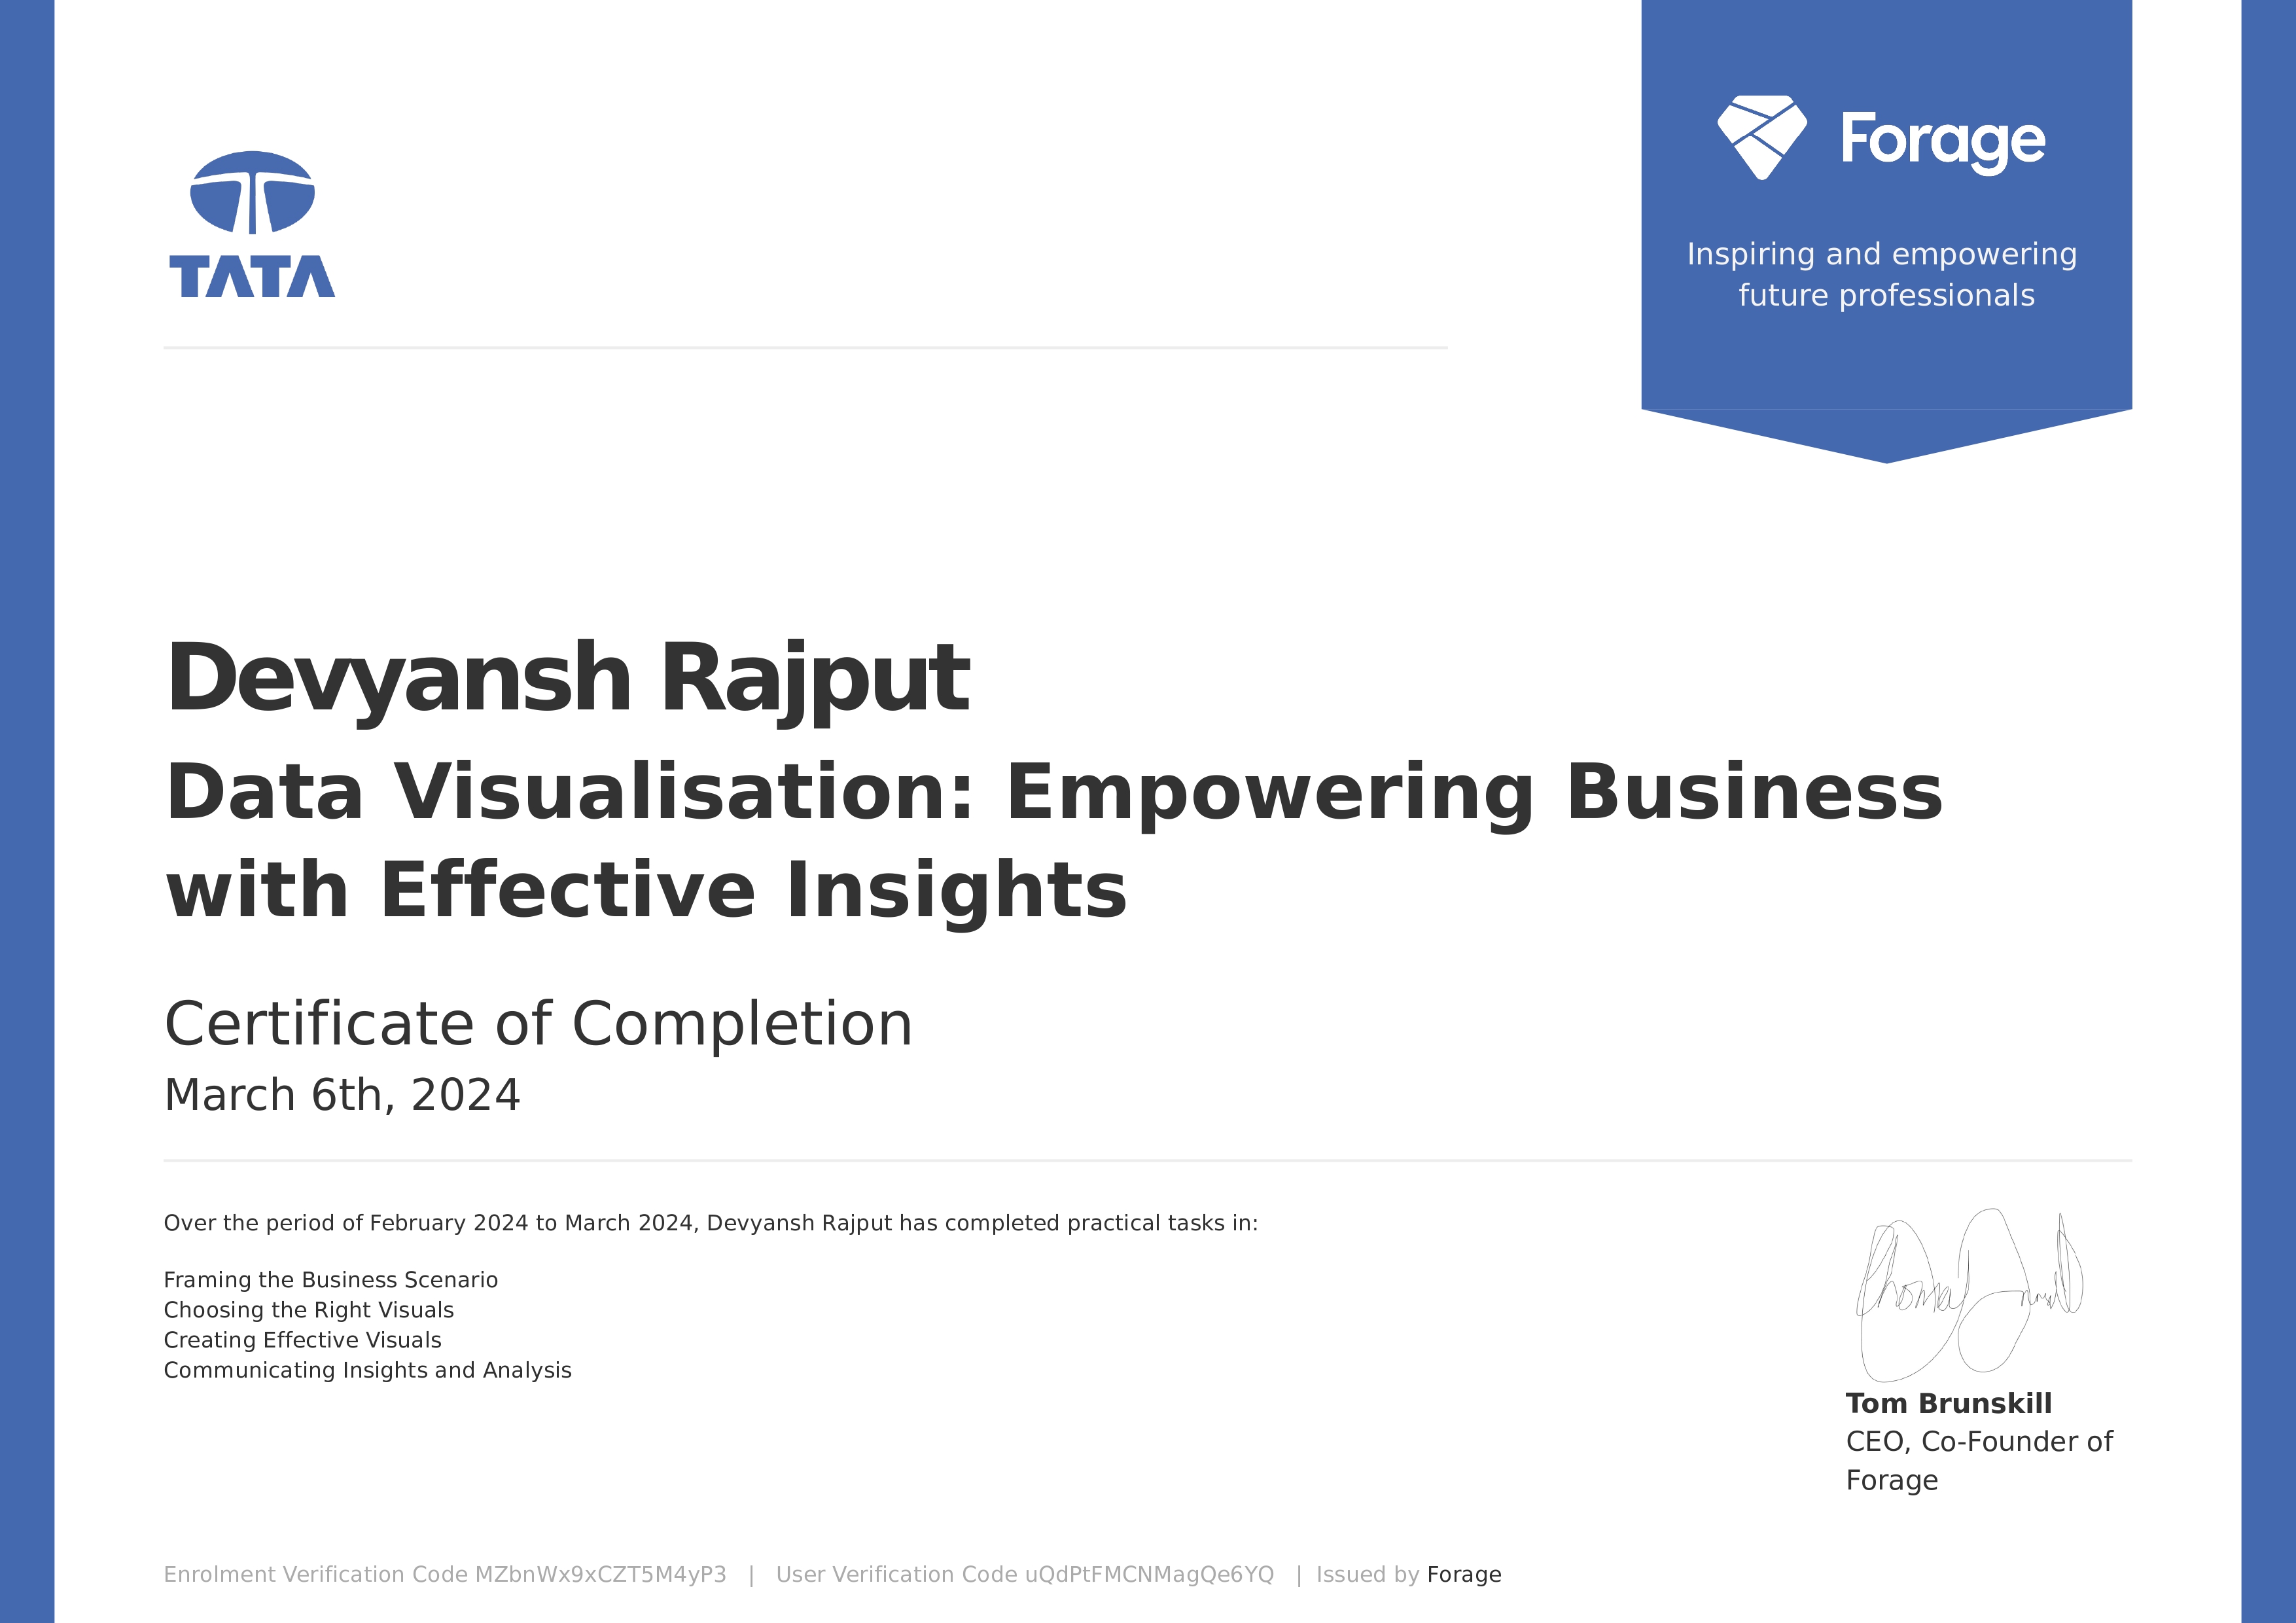
Certificate of Completion

Tools & Technology
Excel
Power BI
Task 1: Framing the Business Scenario
- Write questions that you think will be important and relevant to the CEO and CMO from the perspective of business leaders to analyse data more effectively from the given dataset.
Task 2: Choosing the Right Visuals
- Ensuring data quality and integrity.
- Identify the visual which would explain the data and insights in the simplest possible manner to communicate information effectively.
Task 3: Creating Effective Visuals
- Create the visuals around the questions the CEO and CMO requested to help executives with effective decision making using PowerBI
Task 4: Communicating Insights and Analysis
- Performed analysis to extract insights from the transaction and date tables.
- Joined the transaction and date tables using an inner join and applied filters by year, market, month, and currency to select the relevant data.
- Calculated the total sales amount, number of transactions, and other metrics of interest using aggregation functions.